
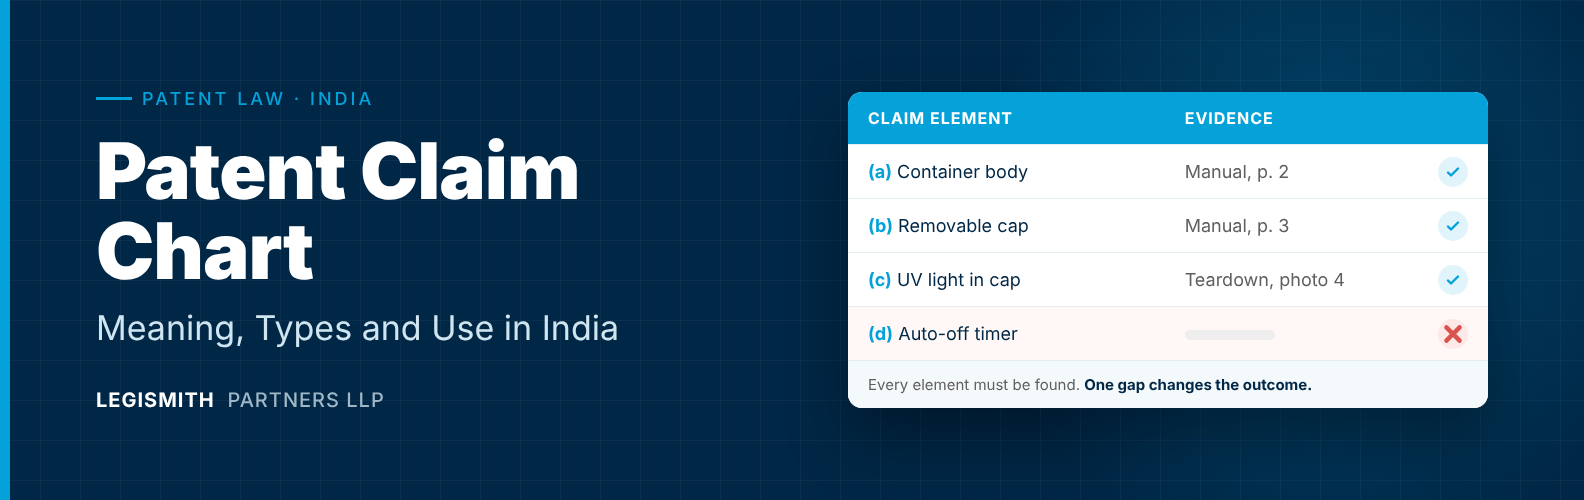
Most patent disputes come down to a simple question: does the other product contain every part of the patent claim? A patent claim chart is the tool used to answer it. It places the claim on one side and the evidence on the other, line by line, so that gaps become easy to see.
In India, the claim chart is no longer just a drafting habit. The Delhi High Court’s patent rules now expect claim mapping in infringement suits, and recent judgments have turned on whether a chart was filed at all. This guide explains what a claim chart is, how it is prepared and how Indian courts use it.
In short: A patent claim chart is a table that splits one patent claim into its separate elements and shows, for each element, where it is (or is not) found in a product, a technical standard or earlier prior art. It supports an argument; it does not prove infringement or invalidity on its own.
What is a patent claim chart?
A patent claim chart is an element-by-element comparison between a patent claim and something outside the patent. That “something” is usually an accused product, a published document or a technical standard. The process of building one is also called claim mapping or claim charting.
The chart focuses on the claims because the claims, not the description or drawings, set the legal boundary of a patent. Under Section 48 of the Patents Act, 1970, the patentee can stop others from making, using, selling or importing what the claims cover. A chart tests whether a product falls inside that boundary.
Most charts have two to four columns: the claim element, the matching feature, the evidence with a precise reference, and a short comment.
Patent claim chart example
The easiest way to understand a claim chart is to see one. Take this hypothetical claim:
“A drinking bottle comprising: (a) a container body; (b) a removable cap; (c) an ultraviolet light source mounted in the cap; and (d) a timer that switches off the light source after a preset period.”
Here is how the claim might be mapped against an imaginary “Product X”:
Claim element | Feature in Product X | Evidence | Comment |
(a) a container body | Steel 750 ml body | User manual, p. 2, fig. 1 | Present |
(b) a removable cap | Screw-on lid | User manual, p. 3 | Present |
(c) a UV light source mounted in the cap | UV-C LED inside the lid | Teardown photo 4 | Present |
(d) a timer that switches off the light after a preset period | Light turns off after 60 seconds | Test video, 00:45–01:10 | Present, confirmed by testing |
Now imagine Product X’s light switches off only when the lid is opened, not on a timer. Row (d) would be empty. Because infringement is usually judged element by element, one missing element generally means the claim is not literally infringed. That is the real value of a chart: it shows exactly where a case is strong and where it is weak.
What are the types of claim charts?
Claim charts are grouped by what the claim is compared with and why. The format stays similar; the purpose changes.
Type | Claim compared with | Usually prepared by | Purpose |
Infringement or evidence-of-use (EoU) chart | An accused product or process | Patent owner | Show every element is present |
Non-infringement chart | The party’s own product | Accused party | Show at least one element is missing |
Invalidity or prior-art chart | Earlier patents, papers or products | Accused party or opponent | Show lack of novelty or inventive step |
Standard-essentiality (SEP) chart | A technical standard, such as 4G | Owner of a standard essential patent | Show the standard cannot be used without the claim |
Freedom to operate chart | Your planned product | Your adviser | Assess risk before launch |
If you are planning a launch rather than a dispute, our article on freedom to operate analysis explains how these charts fit into a wider risk review.
How to prepare a patent claim chart
Preparing a patent claim chart involves seven broad steps, moving from the patent’s legal status to a reviewed, evidence-backed table:
- Check the patent’s status. Confirm on InPASS that the patent is in force and use the claims as granted or amended, not as first filed.
- Define the purpose. An infringement chart, an invalidity chart and an FTO chart need different evidence.
- Split the claim into elements. Semicolons are a starting point, but long elements may need breaking down further.
- Work out what each term means. Read the terms in light of the specification and the prosecution history.
- Gather evidence. Use technical documents, product testing, teardowns, source code (where available) or the relevant standard. Check that the product was sold after the patent’s priority date.
- Map each element with a precise reference. Cite the page, figure, timestamp or test result, and explain why the feature meets the element.
- Review the gaps. Mark which rows are proven, which rely on inference, and which are missing.
Why are process patents harder to chart?
A process usually happens inside the other party’s factory, so direct evidence is rare. Section 104A helps in limited cases. If the patentee first proves that the defendant’s product is identical to the product of the patented process, the court may ask the defendant to prove its process is different. The Delhi High Court has stressed that identical products are a precondition for this shift.
Claim charts under the Delhi High Court patent rules
The High Court of Delhi Rules Governing Patent Suits, 2022, notified on 24/02/2022, make claim mapping part of patent litigation procedure. The Delhi High Court is India’s busiest IP court, so these rules shape practice nationally.
Court document | What it must contain about claim mapping (summary) |
Plaint (filed by patent owner) | An infringement analysis based on the granted claims, and a claims-versus-product or process chart, including mapping through standards |
Infringement brief | An element-by-element comparison with the defendant’s product; for SEPs, claim charts mapping claims to the standard |
Written statement (defendant) | A response to the plaintiff’s claim chart and a technical analysis |
Counter-claim for revocation | A chart showing which claims are hit by which prior art, or combination of prior art |
The briefs are usually limited to ten pages each and are filed before the first case management hearing. You can read the rules on the Delhi High Court website.
How have Indian courts used claim charts?
Indian courts have treated claim charts as key evidence, especially in standard essential patent (SEP) cases, and have ruled both for and against patent owners on that basis.
Case | Date | Role of the claim chart |
28/03/2024 | Ericsson’s charts mapping its patents to the standard went unrebutted. The court awarded damages of about ₹244 crore. | |
Philips v Bathla | 13/10/2025 | The court found the claim-to-product mapping insufficient and held that standards compliance alone did not prove essentiality. |
K.K. Bansal v Philips (Division Bench) | 18/05/2026 | A 2018 royalty decree was set aside, partly because no claim charts mapped the patent to the standard. |
The lesson runs both ways. A strong chart can carry a case, and a missing one can sink it. For more recent rulings, see our round-up of top patent cases of 2025 in India.
What about literal infringement and equivalents?
A chart first tests literal infringement, where every element is present as claimed. If an element is replaced by something that does the same job in the same way, the question becomes whether infringement exists beyond the literal words. Indian courts have applied a “pith and marrow” approach and, in some cases, a doctrine of equivalents, but the law here is less settled than in the US. A chart should therefore treat any equivalence argument separately and explain it fully.
Common claim chart mistakes
Most weak claim charts fail for the same few reasons:
- Copying the claim words into the evidence column instead of naming the actual product feature
- Vague evidence, such as “see brochure”, with no page, figure or timestamp
- Relying on marketing material rather than technical documents or tests
- Assuming a feature “must be there” because the end result looks similar
- Stretching claim terms beyond any meaning a court would accept
- Treating standards compliance as proof that a patent is essential
- Charting the wrong claims, such as an expired patent or pre-amendment wording
A useful test: if a row does not contain the word “because” or a clear reason, it probably needs more work.
Can AI prepare a patent claim chart?
AI tools can now produce a draft claim chart quickly by matching claim language to documents. That can save time on finding evidence. However, the tool does not decide what a claim term legally means, whether the evidence is reliable, or whether a court would accept the mapping. Any AI-drafted chart needs review by someone who understands both the technology and patent law.
What should you do if you receive a claim chart?
Patent owners often attach a claim chart to a legal notice. Before you respond, check the chart calmly against these points:
- Is the patent in force in India, and are these the current claims?
- Is every element charted, or are some rows vague or empty?
- Does the evidence relate to your actual product and model?
- Does it depend on an unusual reading of the claim terms?
- Does it rely only on standards compliance or marketing material?
- Is there earlier prior art that could challenge the claim?
Do not ignore the deadlines in the notice. If the chart is hard to follow, you can ask our team to explain it before deciding your next step.
Secure Your Patent in India.
Learn about the statutory requirements and process for patent filing. Navigate complex legal frameworks with architectural precision and transparency.
Frequently Asked Questions
Is a claim chart mandatory in Indian patent suits?
The Patents Act does not use the term, but the Delhi High Court Rules Governing Patent Suits, 2022 expect claims-versus-product mapping in the plaint and a response to it in the written statement. Courts also treat charts as key evidence in SEP cases.
Does a claim chart prove infringement?
No. A claim chart presents a theory and the supporting evidence. The court decides infringement after construing the claims and testing the evidence.
What is an evidence-of-use chart?
An evidence-of-use (EoU) chart is another name for an infringement claim chart. It maps each claim element to evidence that a specific product uses it.
What is the difference between an infringement and an invalidity chart?
An infringement chart compares a claim with an accused product. An invalidity chart compares the same claim with earlier prior art to show it was not new or was obvious.
Can I prepare a claim chart myself?
You can prepare a first draft to organise your thinking. For a legal notice, licensing talks or litigation, the claim interpretation and evidence should be reviewed by a qualified patent professional.
Final Thoughts on the Patent Claim Chart
A patent claim chart turns a long, complex claim into a simple question asked several times over: is this element here, and where is the proof? Built carefully, it brings clarity to infringement analysis, licensing talks and court proceedings. Built carelessly, it can expose a case’s weakest point. In India, recent rules and judgments have made that clarity more important than ever.
At Legismith LLP, we believe that understanding the chart is the first step to understanding any patent dispute. You can learn more about our work on the patent services page, or read how the same element-by-element approach is used before filing in our patentability search report guide.
Have you ever had to compare your own product with someone else’s patent claims, and which part did you find hardest?
Disclaimer
The content provided in this article is for general informational purposes only and does not constitute legal advice. Please consult with a qualified IP attorney for your specific needs.
Protect Your Innovation
Schedule your consultation with our expert IP attorneys to secure your assets and scale your brand globally. Partner with us to build a lasting legacy.