
India now files patents at a record pace, but the activity is not spread evenly across the country. A look at state-wise patent filings in India shows that a handful of states produce most applications, while many others file only a few hundred over 16 years.
New figures based on IP India data cover applications filed between 01/01/2010 and 20/07/2026. At Legismith LLP, we have broken this data down to show which states lead, which states file the least, which fields of technology dominate, and what these trends mean if you are planning to protect an invention.
Which states file the most patents in India?
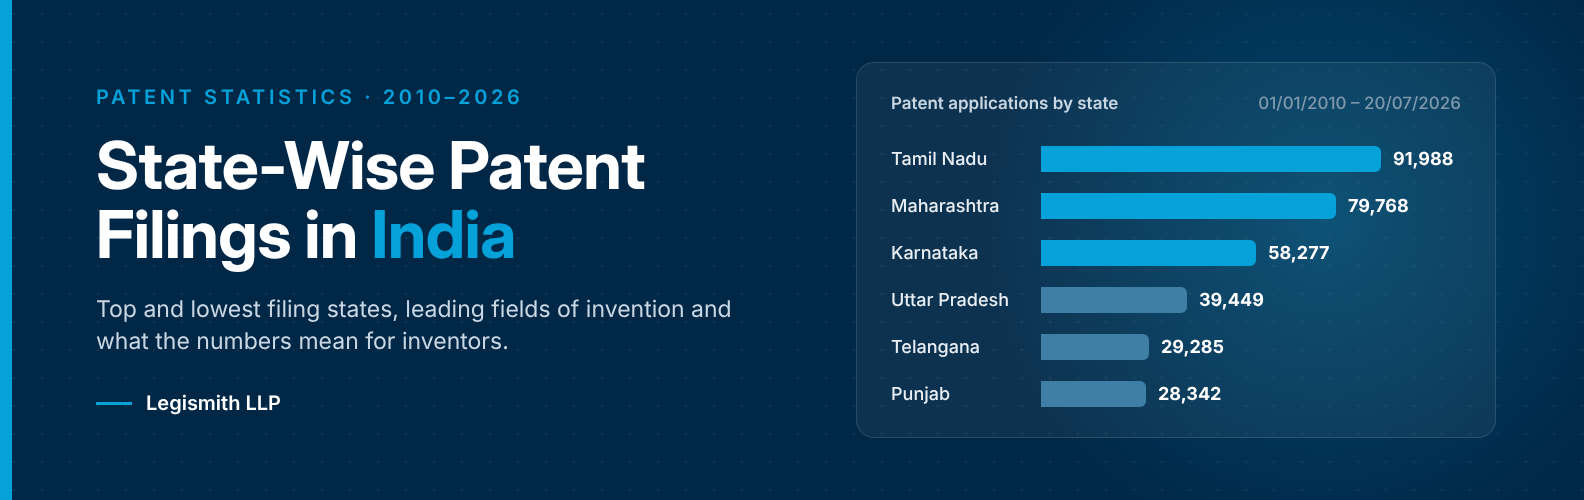
Tamil Nadu files the most patent applications in India, followed by Maharashtra and Karnataka. These were the only three states to cross 50,000 filings between 2010 and July 2026. Together, they account for nearly half of all state-wise filings.
Rank | State | Applications (01/01/2010 – 20/07/2026) | Approx. share |
1 | Tamil Nadu | 91,988 | 19.1% |
2 | Maharashtra | 79,768 | 16.6% |
3 | Karnataka | 58,277 | 12.1% |
4 | Uttar Pradesh | 39,449 | 8.2% |
5 | Telangana | 29,285 | 6.1% |
6 | Punjab | 28,342 | 5.9% |
7 | Delhi | 26,624 | 5.5% |
8 | Andhra Pradesh | 21,293 | 4.4% |
9 | Gujarat | 20,358 | 4.2% |
10 | Haryana | 12,623 | 2.6% |
Shares are our calculations from a combined total of about 4,81,397 applications across all states and union territories.
How concentrated is patent activity?
The top three states hold about 48% of all filings. The top ten hold about 85%. This means the remaining 25-plus states and union territories share only around 15% of applications filed since 2010.
Why do Tamil Nadu, Maharashtra and Karnataka lead?
These states share a few common strengths that tend to produce patentable work:
- Large university networks: Tamil Nadu has one of India’s highest higher-education enrolment rates and a dense cluster of engineering colleges.
- Industrial bases: Automobile, electronics, chemicals and pharmaceutical hubs in Chennai, Pune, Mumbai and Bengaluru generate ongoing R&D.
- Technology and start-up ecosystems: Bengaluru and Pune host many software, engineering and deep-tech companies.
- Awareness and access: More IP professionals, incubators and institutional IP cells make filing easier to start.
What types of patent applications do the top states file?
Almost all filings from the top states are ordinary applications, meaning they are filed first in India. In 2022–23, ordinary applications made up over 99% of filings from each of Tamil Nadu, Maharashtra and Karnataka, according to the IP India Annual Report 2022–23.
State (2022–23) | Ordinary | Convention | PCT national phase |
Tamil Nadu | 7,615 | 32 | 39 |
Maharashtra | 5,572 | 9 | 45 |
Karnataka | 5,369 | 28 | 11 |
Convention and PCT national phase applications usually come from applicants who first filed abroad. Foreign applicants use these routes most, but their filings are counted under their home country, not an Indian state. Our guide to national phase patent filing in India explains how that route works.
Which fields of technology lead in the top states?
IP India does not publish field-of-invention data state by state, so an exact split is not available. However, the leading filers in each state, named in the official annual reports, show where the activity comes from:
- Tamil Nadu: Mostly engineering colleges and universities. Saveetha School of Engineering (Chennai) and Hindusthan College of Engineering and Technology (Coimbatore) were among India’s top R&D filers in 2022–23. TVS Motor Company was the top Indian filer of PCT applications through the Indian Receiving Office that year, which points to strength in automotive and mechanical work.
- Maharashtra: More corporate filers. Tata Consultancy Services was among the top Indian applicants in information technology. Mumbai and Pune are also major centres for chemicals, pharmaceuticals and automobiles.
- Karnataka: Information technology, electronics and communication from Bengaluru’s technology sector. Jain (Deemed-to-be University) was among India’s top academic filers.
Since computer science and electronics is now the largest field nationally (see below), it is likely to be a large share in all three states. If you would like to understand which category your own invention falls into, our patent services page outlines how we assess inventions before filing.
Which states have the lowest patent filings?
The north-eastern states, small union territories and island regions file the fewest patents. Ladakh and Lakshadweep recorded just 3 applications each over the entire period.
State / Union Territory | Applications (2010 – 20/07/2026) |
Goa | 725 |
Tripura | 245 |
Nagaland | 211 |
Meghalaya | 209 |
Manipur | 177 |
Arunachal Pradesh | 136 |
Mizoram | 122 |
Sikkim | 91 |
Andaman & Nicobar Islands | 36 |
Ladakh | 3 |
Lakshadweep | 3 |
Excluding Assam (2,021), the seven other north-eastern states together filed fewer than 1,200 applications. That is less than what Tamil Nadu files in a typical month and a half.
What about the states in the middle?
West Bengal (11,569), Rajasthan (11,042), Uttarakhand (8,434), Kerala (7,623), Madhya Pradesh (7,179) and Odisha (6,805) form the middle tier. Bihar (1,878), Chhattisgarh (2,303) and Jharkhand (4,542) remain low compared with their population size.
Low numbers usually reflect fewer research institutions, smaller manufacturing bases and lower IP awareness. They do not mean a lack of ideas. Many inventions from these regions are never filed and enter the public domain without protection.
Which field of invention has the most patent filings?
Computer science and electronics is now the largest field of patent filings in India. According to the IP India Annual Report 2024–25, its share rose from 20.4% in 2020–21 to 26.7% in 2024–25, after peaking near 28% in 2023–24.
Field of invention | Approx. share of applications (2024–25) | Five-year trend |
Computer science and electronics | 26.7% | Rising strongly |
Mechanical engineering | 16–17% | Slowly declining (from about 18%) |
Chemical and pharmaceutical | 13–14% | Recovered after a dip in 2021–22 |
Communication | About 9% | Declining (from 11.4%) |
Biomedical | 4–5% | Stable |
This shift points to growth in software-linked inventions, artificial intelligence, electronics and the Internet of Things. Note that software “as such” is not patentable under Section 3(k) of the Patents Act, 1970. Inventions must show a technical effect or technical contribution to qualify.
Who is filing these patent applications?
Educational institutions have become one of the largest filer groups. Their applications rose from 11,150 in 2020–21 to 45,776 in 2024–25, about 38% of all filings that year. Indian applicants filed 68,201 applications in 2024–25, or 61.79% of the total of 1,10,375.
This partly explains why states with many universities, such as Tamil Nadu, Punjab and Uttar Pradesh, rank so high. It also matters for how you read the numbers, as we explain below.
What do state-wise patent statistics not tell you?
State-wise patent filings in India measure applications, not granted patents. A high filing count is a sign of activity, but it is not the same as successful protection.
- Filings are not grants: India granted 33,504 patents in 2024–25, far fewer than the applications filed that year.
- Quality varies: Some high-volume filers, including certain institutions, have low grant rates.
- Address-based counting: Applications are counted by the applicant’s stated address, so a company’s head office state may gain filings made by research teams elsewhere.
- Boundary changes: Telangana was formed in 2014, so earlier filings from that region appear under Andhra Pradesh.
If you are filing, a well-drafted specification that meets novelty, inventive step and industrial applicability matters far more than any filing count. Our patent services page explains how each stage of protection works.
Does your state affect where you file a patent?
Your state decides which regional patent office has jurisdiction, but not your rights. A patent granted in India is valid across the whole country. Most filing now happens online through the IP India e-filing portal.
Patent office | Main states covered |
Mumbai | Maharashtra, Gujarat, Madhya Pradesh, Goa, Chhattisgarh, Dadra and Nagar Haveli and Daman and Diu |
Chennai | Tamil Nadu, Karnataka, Kerala, Andhra Pradesh, Telangana, Puducherry, Lakshadweep |
Delhi | Delhi, Uttar Pradesh, Punjab, Haryana, Rajasthan, Himachal Pradesh, Uttarakhand, Jammu & Kashmir, Ladakh, Chandigarh |
Kolkata (head office) | West Bengal, Odisha, Bihar, Jharkhand, all north-eastern states, Andaman & Nicobar Islands |
The appropriate office is based on where the applicant (or first-named applicant) resides or has a place of business. For foreign applicants, it depends on the address for service in India. Our guide to national phase patent filing in India covers this for international applicants.
If you are unsure which office applies to your application, you can schedule a call with our team to understand the process.
Secure Your Patent in India.
Learn about the statutory requirements and process for patent filing. Navigate complex legal frameworks with architectural precision and transparency.
Frequently Asked Questions
Which state is number one in patent filing in India?
Tamil Nadu, with 91,988 applications filed between 01/01/2010 and 20/07/2026.
Which state files the fewest patents?
Among all regions, Ladakh and Lakshadweep recorded the fewest, with 3 applications each. Among full states, Sikkim filed the fewest, with 91.
How many patent applications does India receive each year?
India received 1,10,375 applications in 2024–25 and around 1,43,729 in 2025–26, according to official figures.
Is Maharashtra still a leading state for patents?
Yes. Maharashtra ranks second overall with 79,768 applications. It held the top position for many years, including in 2018–19, before Tamil Nadu moved ahead in recent years.
Final Thoughts on State-Wise Patent Filings in India
The data shows a clear pattern. Tamil Nadu, Maharashtra and Karnataka drive nearly half of India’s patent activity, while the north-east and smaller union territories remain far behind. Computer science and electronics now lead all fields, and universities have become major filers.
At Legismith LLP, we believe understanding these trends helps inventors in every state see that patent protection is open to them, wherever they are based. You can explore more guides on our blog, or get in touch if you have questions about protecting your own invention.
Did your state’s position on this list surprise you?
Disclaimer
The content provided in this article is for general informational purposes only and does not constitute legal advice. Please consult with a qualified IP attorney for your specific needs.
Protect Your Innovation
Schedule your consultation with our expert IP attorneys to secure your assets and scale your brand globally. Partner with us to build a lasting legacy.